Image driven sound generation
Akemi
Ishijima
Composer,
London, UK
email: akemi@city.ac.uk
Yoshiyuki Abe
Artist,
Tokyo, Japan
email:
y.abe@ieee.org
Abstract
With the object of creating abstract computer graphics animation
with electroacoustic sound, an automatic image-driven sound generator was
developed. Image sampling methods, which in principle sample one datum from
each animation frame、 was tested
as being effective for generating pitch, dynamic structure and stereo
image. Wavelet transform, which
provides multi-resolutional information of the signal made of data from image
frames, was useful for determining other modulation signals including temporal
cues. The generative method of creating
music for animation also involves human judgement. At the system development stage, special attention was taken
regarding pitch and loudness, since our perception of these factors varies
depending on the register and it is not always proportional to what we read in
the values of frequency and amplitude.
Knowledge on orchestration proved useful for creating tangible and
effective melodic and harmonic structure.
One script file proceeds all the way, from making an animation clip,
generating CD quality sound track and combining image and sound into a movie
file for the final product.
1. Introduction
Sound plays an important role in films and video works by providing
space environment for the audience. It also enhances the visual message and
adds reality to animation films. Many film masterpieces are remembered for
their theme music. In most cases, sound
creation and image making are separately developed and ordinarily a composer
starts to work after receiving the screenplay or seeing dailies. This is so that the composer understands the
atmosphere and the theme of each scene.
Animation clips often have a human voice, a concrete sound, or some
electronic music on the sound track. With our animation clip of flying geometric objects,
composer referred to the design charts, which involve timings of object spin
and changing view positions[1].
"The timing chart made the compositional work easy, because it
could be used as the on/off chart for musical events. All I have to do was to
determine the suitable sound to be triggered at each point accordingly
(Ishijima)." How do you start
sound-making for algorithmically generated abstract video clips? Unlike films, there is no script, no studio
scene, or no actor/actress on screen.
Images you've never seen are there.
Just the impression you have is the material for your creative work.
This paper presents the second phase of the research on computer
generated animation with abstract images. This time, we tried to generate a
whole sound stream by using data sampled from each image frame without any
involvement of a video/sound editor console. An image clip is generated first.
Then the visual data is lead up to sound generation. Finally, the image and the
sound are combined into a movie file. We have tested some methods to sample
data from a computer generated animation which has uncompressed 640x480
images.[Fig.1]
In the attempt of making sound with sampled data of image, the first
confrontation is data file discrepancy.
While sound requires to be a continuous data file, video consists of a
sequence of discrete data of image frames.
Image[2] Sound
Image
format TARGA Sampling
freq. 44100Hz
Image size 640x480 Sampling
res. 16bits
Colour depth 24bits Channels 2
Frames/sec 30 Num
of Data 2,646,000/min/ch
Frames/min 1800 Bytes
of Data 10,584,000
Bytes/min
Data
size/frame 921,600
Bytes/frame
Data
size/sec 27,648,000
Bytes/sec
Data
size/min 1,658,880,000
Bytes/min
Fig.1 Specifications of image and sound files.
2. Sound
2.1 Music
Parameters
In any music, pitch is probably the most significant element which
creates tangible musical impression. Although other elements such as rhythm and
timbre also play important roles, which we discuss later, pitch creates melody
and harmony, and is considered the most essential element for any organised
sound. In this sense, the most basic information required for musical sound are
Pitch, Amplitude and Note length. Colour data, which represent the visual impact
of each frame, are a suitable source for generating both pitch and amplitude
information. In order to define note length i.e. duration of each pitch, values
are defined by the duration derived from the varied levels of the wavelet
transform.
In order to express a pitch, one sine wave is enough but for more
interesting timbre, a single sine tone is too simple. To achieve rich sound, layers of sine waves which have different
pitch and duration are superimposed.
Tracking events in left, centre, right areas of the image in respective
audio channels would produce coherent spatial
emphasis in the visual and audio material.
For the purpose of capturing spatial property of the image material,
various combinations of sampling positions are tested.[Fig.2]
+-----------+-----------+ +-----------+-----------+ +-----------+-----------+ +-----------+-----------+
| |
| | |
| | |
| |
| |
| | | |
| |
| | |
o | | |
| + * |
| + o * |
| + * | |
+ + o * *
|
| |
| | |
o | | |
| |
| | |
| | |
| type 1 | |
type 2 | |
type 3 | |
type 4 |
+-----------+-----------+ +-----------+-----------+ +-----------+-----------+ +-----------+-----------+
+-----------+-----------+ +-----------+-----------+ +-----------+-----------+
| |
| | |
|
| + + o
* * | | | |
o o o | + left
| |
| + + o o
o * * | | |
| + + o
* * | | | |
o o o | o left+right
| |
| + + o o
o * * | | |
| + + o
* * | | | |
o o o |
* right
| type 5
| | type 6 | |
type 0 |
+-----------+-----------+ +-----------+-----------+ +-----------+-----------+
Fig.2 Sampling
positions
For sound to be recognised as music, there must be tangible temporal progression such as melody and
rhythm. Harmony is a preferable
element which enriches music both momentarily and progressively. A regular beat is not necessary but useful
to create sense of speed and progression.
Dramatic visual development such as change of scene, or irregular
movement ought to be synchronised or in some sort of causal relation to
accentuation in music.
2.2 Parameters for
Digital Sound
Above discussion is based on the psychological variables of musical
sound. For the sake of clarification, conventional terms such as note or melody were used, but they are not of central concern for the composer. The goal is to generate a
spectromorphological sound track rather than note-based composition. For
digital, or any electronic sound, information which describes physical
variables of phenomena of sound is required.
Fig.3 shows correspondence between music and physical properties.
Digital sound data consists of a series of amplitude values of sound measured
at the sampling frequency of 22.05 kHz, 44.1 kHz, or 48 kHz. Ordinary dynamic range is 16 bits for each
channel.
Music
property Physical
property
Pitch Frequency
Loudness Amplitude
Note length Duration
Timbre Waveform=Sum
of multiple sine waves
Fig.3
3. Sampling Image
Data
For making 44,100Hz CD quality sound, 1470 data samples are required for
one image frame duration, or 33 milliseconds. While there are some methods to collect this
number of data from one image, the safe way is to apply one-sample-from-one-image rule because you have to avoid overtones of 30Hz produced by the 33ms repetitive data sequence. This rule is also effective to keep
consistency of trans-frame events. This
time, our solution is simple linear
interpretation of colour data into pitch value, which is held for the
duration of one frame,
for the main pitch stream. One of the major advantages of this
method is that it is free from 30Hz pattern repetition. The length
of a frame provides enough time for our ears to recognise the frequency as a
pitch. At the same
time, it is short enough for creating impressions of continuous pitch slide. In order to
keep the audio transition smooth, the program checks the phase angle at the end
of 33ms segment and makes the next to waveform to start in-phase by adding offset phase value. This is a must to design a smooth tone shifting
when you synthesize a waveform.[Fig.4]
Fig.4 Phase matching. Same signal without(upper) and with(lower) phase
matching.
4. Data
Transformation
What can be obtained from visual image in any case is a set of pure data
which then will be transformed to a sound file. To construct Image-to-Sound
transformation, it is important to find suitable source for suitable audio
parameters. We used wavelet analysis of the whole length waveform for the
material of some sub tracks of this work[3].
4.1 Pitch and
Harmony
Once a list of frequency are obtained, each frequency can be
harmonized by adding partials expressed in ratio of integers such as 1/4, 1/2, 3/4, 2, 3, 4,
5, etc. relative to the original frequency.
Problem here is how to define the harmonisation algorithm so that the
result would become audible and musical.
First thing to pay attention to is that the audible frequency range for human ears is roughly between 20Hz and 20kHz, so that the resulting frequency should fall into this range. Secondly,
our perception of loudness and pitch separation is not linear. Traditional idea
of instrumentation is helpful. Contrabass part is often doubled by cellos playing in an octave(2nd
partial). Violas might be playing in 5th(3rd partial) or an octave(4th partial)
above the cello. This means, sound harmonized according to the natural harmonic series creates impression of harmonic stability. Building up a harmony on a lower frequency also helps to enhance
the perceived level (loudness) of low pitched sound
against the fact that our perceived loudness is lower than the actual signal
intensity in low frequency region.. Regarding stability, another important
principle is that the longer the note, the more stable the music.
In order to extract a principal pitch movement, colour data are taken from the image area of "type 4" [Fig.2]. What is translated to higher frequency has more
meaning than what became lower frequency, since the frequency values reflect impression level of the image. 0Hz means no colour. Thus, we employed a method of harmonising 'downwards' rather than upwards. The frequency obtained is interpreted as the 8th partial of a natural harmonic series, and harmonised with 7th, 5th and 3rd partials. The amplitude of each partial is controlled by the density of Red, Green and Blue respectively. High pass filters is applied to cut off
inaudible signals below 20Hz. In this
way, an upper structure is created from the main pitch movement. Octave intervals are omitted here, because it will be used for constructing a lower structure. Partials
used for the harmonisation are summarised as below.
Upper Structure 3
5
7 8
Lower Structure 1/4 3/4 1
Example C1 G2 C3 G4 (E5) (Bb5) C6
Frequency(Hz) 32.7 98.1 130.8 392.4 654 915.7 1046.5
What is interpreted as the fundamental
frequency, that is 3octaves lower than the initially obtained frequency, is
harmonised with the 3/4 and 1/4 partials. This provides harmonically stable
base for the upper structure. 20Hz – 200Hz band pass filter is applied
so that the final frequency range for the lower structure becomes equivalent to
the range of contrabass. Different sampling frame rate were applied to create rhythmic variety. Duration
information for longer sound is obtained from 4th to 6th level wavelet
transform.[Fig.5]
When the upper and lower structure are
mixed, the resulting sound shows good separation in terms of pitch and
frequency range. When an audio event is happening in higher register, mid to
low range is suppressed except for one or two partials supports the overall
harmonic structure. In the middle-range frequency, where our ears are most
sensible, most partial elements are present to provide rich harmonic structure.
Pitch separation between each harmonic element is good throughout.
|
|
|
|||
|
S4 |
||||
|
H1 |
||||
|
H2 |
||||
|
H3 |
||||
|
H4 |
||||
|
H5 |
||||
|
H6 |
||||
|
L6 |
||||
|
L6s |
||||
|
S5 |
||||
|
S5xL6s |
||||
|
H4s |
||||
|
H6hold |
||||
|
S1+S4 |
||||
|
S1 |
||||
|
S4 |
||||
|
|
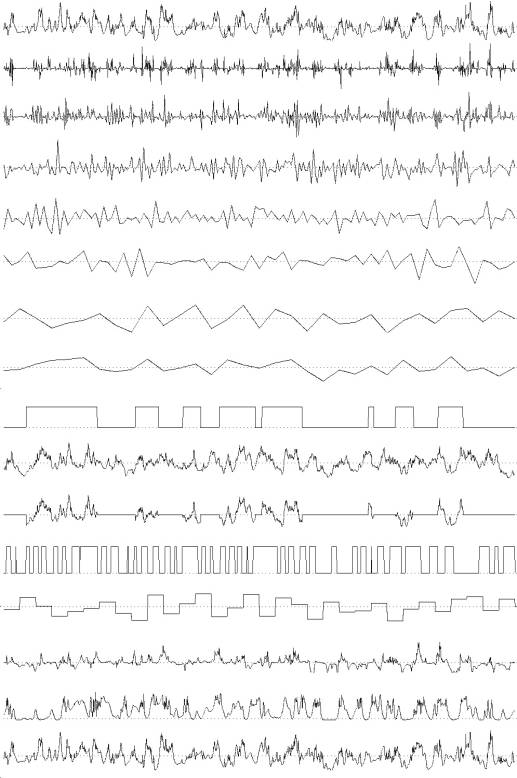
Fig.5 Waveforms. From top to bottom, S4:sampled image data(type 4), H1-H6:wavelet level 1-6
(HPF), L6:wavelet level
6(LPF), L6s:sliced L6, S5:sampled image data(type 5), S5xL6s, H4s: sliced S4, H6s: sliced
H6, S1+S4, S1:sampled image data(type 1), S4(similar to the top waveform). The waveforms of
H1-H6 and L6 are stretched to the original signal's length. H1-6 and L6 are transformed S4 by Daubechies' wavelet, N=2. S4=H1+H2+H3+H4+H5+H6+L6
4.2 Stereo sound
All sampling types produced good results which reflect significant visual events involving object
movement and colour change across the screen.
As number of sample location increases, sampled data include more visual
events but averaging results in relatively lower resolution of event.
In order to capture minimal movement across screen type 2 and 4 are
suitable since the most visual information is concentrated in the central area
of the screen.
|
|
|
|||
|
L |
||||
|
R |
||||
|
L |
||||
|
R |
||||
|
L |
||||
|
R |
||||
|
|
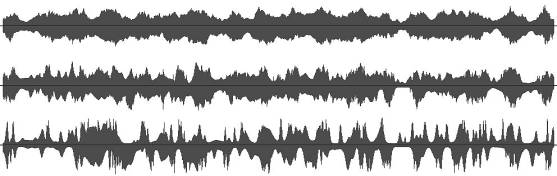
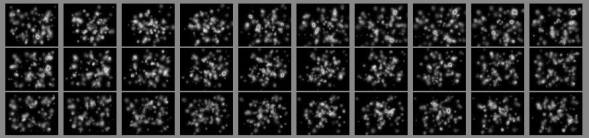
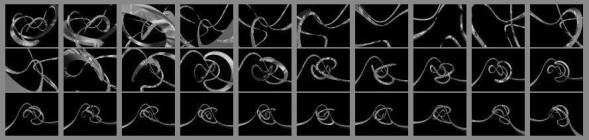
Fig.6 Animation with random abstract images. Channel data are type
6(top), 4(middle) and
1(bottom). Type 1 results a good channel separation and
is used for sub channel data.
Because it misses events on the
central part, the most important area, it is not used for
the main signal.
|
L |
|
|||
|
R |
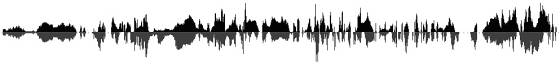
Fig.7
Animation used geometric surfaces. Channel data(type4) shows clear
channel separation
and variety of image data levels.
4.3
Synchronisation and Alienation
Transforming data into sound is not sufficient for sound design required for animation. For a quality animation, sound must not always follow the images. That means we need to detect visual events and have to decide whether the sound should cooperate or alienates from them. It is very hard to give a rule to such a highly creative process. As an attempt, we used other image data and AND OR XOR process for the decision making. In the test version, we set a
rule for switching the sound track between synchronisation and alienation modes. The cue sheet is made of derivative data chart of wavelet transform.
5. Process Flow
This research developed all the necessary tools for the processes discussed above. A script file proceeds all the way from generating image list to
integrating the image and sound data into a movie file.
[Fig.8][Fig.9]
#/bin/sh
umkga2003b
gaa 22 640 480 100 2000 # generate
gaa00 .. gaa21, 640x480 image size
apol_light gc4 22 99
gaa00...gaa18 # gaa(22 files) -->
gac(2101 files)
utga-ga2003v
# raytracing
uanim2dat
ggg 4 0 2048 ggg #
.tga --> ggg-4.dat(type 4)
ufwt2
gc4.fdat fwt1 # ggg-4.dat --> fwt.lpf|fwt.hpf (level 1 wavelet)
ufwt2
fwt1.lpf fwt2 #
fwt1.lpf -->
fwt2.lpf|fwt2.hpf(level 2 wavelet)
ufwt2
fwt2.lpf fwt3 #
fwt2.lpg -->
fwt3.lpf|fwt3.hpf(level 3 wavelet)
ufwt2
fwt3.lpf fwt4 #
fwt3.lpg -->
fwt4.lpf|fwt4.hpf(level 4 wavelet)
ufwt2
fwt4.lpf fwt5 #
fwt4.lpg -->
fwt5.lpf|fwt5.hpf(level 5 wavelet)
ufwt2
fwt5.lpf fwt6 #
fwt5.lpg -->
fwt6.lpf|fwt6.hpf(level 6 wavelet)
udat2env
fwt4.hpf fwt4.env #
fwt4.hpf --> fwt4.env(envelope file)
udat-mod
ggg-4.dat gwt4.env ggw-4.mdat #
.dat + .env --> .mdat (modulation)
udat2aiff
ggw-4.mdat 44100 16 2 ggg4 #
ggw4.mdat --> ggg4.aiff
umkavi
gg4 0 2048 gac gc4 #
.tga + aiff -->gg4.avi
echo "finished"
Fig.8 Script file
Fig.9 uanim2dat generates a data file of animation images.
6. Conclusion
It is possible to create a sound track from data obtained from a succession of abstract images. We have produced a full animation
without interactive editing. To create the music, data which represent impression of the images were collected. Sampling colour data from
different areas of the image also proved effective to create stereo
sound.
For a composer, this method of generating sound directly from images is
an attractive alternative to MIDI and sampling since it gives the composer a
wider and flexible range of frequency free from ordinary 12 note chromatic
scale restriction. Composers can also
be freed from lengthy manual endeavour of reshaping sample files with waveform
editors.
The challenge of the present system is that it is still difficult to
create realistic sound whose waveform has overtone-rich transient at the
attack. To further the variety and
quality of sound, we need to investigate methods of creating different
timbre. Establishing a method
to extract figurative and textural impression would enrich timbre
quality and correspondence between sound and image.
We recognised that only very experienced composers and artists can
control this kind of system at current stage, otherwise it can easily become a
junk footage generator. This project gave us an opportunity to rethink why we
make art. We need to understand an image can provide material for sound design, but it also limits the freedom of creation, a double edged sword.
7. Notes and
References
[1] Ishijima,
A. and Abe, Y., "Algorithmic process for time based arts," GA2002,
Milan 2002.
[2] NTSC video system has interleaved 50.94 fields per second and frame
rate is 29.97 fps.
PAL and SECAM for 50/25.
[3] Wavelet provides time-frequency representation. Computation
cost(AxN) of Fast Wavelet
Transform is less than that of FFT(NlogN) in theory, where constant A
depends on the
chosen filters and N for number of samples. The analysis([X]) is a set of LPF and
HPF'ing process and you can analyse a signal on time-freq basis, or more
exactly it's a
time-scale basis because of its relative frequency resolution is
constant, by cascaded
filtering process on the LPF results as shown below.
Signal-->[X]--(lf1)-->[X]--(lf2)-->[X]--(lf3)-->[X]-->lf4
| |
| |
hf1 hf2
hf3 hf4
Signal= hf1+hf2+hf3+hf4+lf4
[4] Ingrid Daubechies' web site has references on wavelet at
http://www.princeton.edu/~icd/publications/