Random Digital
Clouds – A Generative Art Approach
Dipl.Des. Markus Schein (PhD cand.)
Generative Design Lab, Department of Product Design,
University of Kassel, Germany
digitalpool.khs@uni-kassel.de
Christine Krüger
Department of Product Design, University of Kassel,
Germany
1. Random Digital Clouds – Computer
Generated Drawings
1.1 Analogue and Digital Lines
Lines drawn by humans with their hands are - in a certain way - alive. Mind moves hand and the feeling of the drawn lines, their visual impression, the sound of the movement of the pencil on the paper, are returned. The „smoother“ the used media are, the more potential for freedom is in this interplay of perception, thinking and action. Digitally generated lines are „hard“ - in a double sense: Their algorithmic definitions have to be very strict, the only freedom is in the design of these algorithms and usually ends when the output starts. As well this output of digitally generated drawings doesn't permit much tolerance. The device follows exactly the digital model within the scope of its physical possibilities.
1.2 Intentions
Not important what kind of (drawing-) technique is going to be used,
being digital or analogue or both, techniques are always just media to express
certain concepts. It is of lower importance in what this concept consists and
what fundaments it may have. The intention of putting something into a
different content can lead towards art and this intention is commonly before
the process of creating (or generating) art starts.
1.3 Starting Point – A Random Discovery
The approach of Digital Clouds
has had no artistic intention in advance and from this point of view it is
discussable whether it can be categorized as being (generative) art or not. It
is based on a random discovery that then was carried on further: A small
experiment on evolutionary algorithms tried to evolve a surface based on nine
randomly distributed points towards a plane. Some of the surfaces of the
intermediary stages between the random starting point and the desired goal have
been exported as vector graphics. Mistakes in the export process led to
effects, which somehow have been disturbing the digital aesthetic of the
images: lines missed where they should be, other lines appeared where they
shouldn't, background lines came to the foreground, and so on. The results
seemed to have some characteristics of handmade drawings. Due to these effects
the formerly senseless line-bulks started to make sense. The more time one was
looking at them, the more meaning could be found - similar to the discovery of
figures in clouds slowly passing by.
2. Experiments and Results
2.1 First Experiment - Structure
Starting from this random discovery a simple script was written, which used the same workflow than the experiment described above. This script (a macro file for the CAD-Software IDEAS) places three splines in a fixed construction space. Each one of the splines is defined by three randomly distributed points. Then the splines are connected with a surface. There is a high probability that the resulting surface are self intersecting because of the ran-dom distribution of the points. (See Fig.1)
Then the scripts sets the isoline density of the surface to an average
value, the display method is changed from wireframe to shaded hardware, the
surface object is exported as a *.cgm file and deleted. Then the *.cgm files
are opened in Adobe Illustrator and in a batch process the stroke weight is set
to 0.5 points and the stroke color is set to black. A sequence of 123 files
have been generated by this script in the first experiment.
Figure 2 shows the first 15 figures of this sequence.
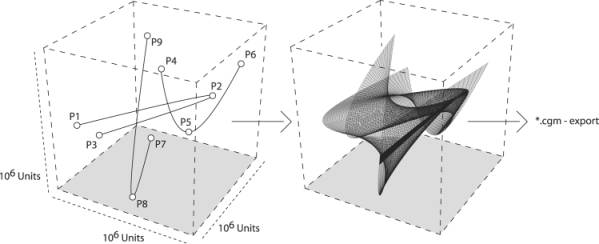
Fig 1 – Basic Script Structure
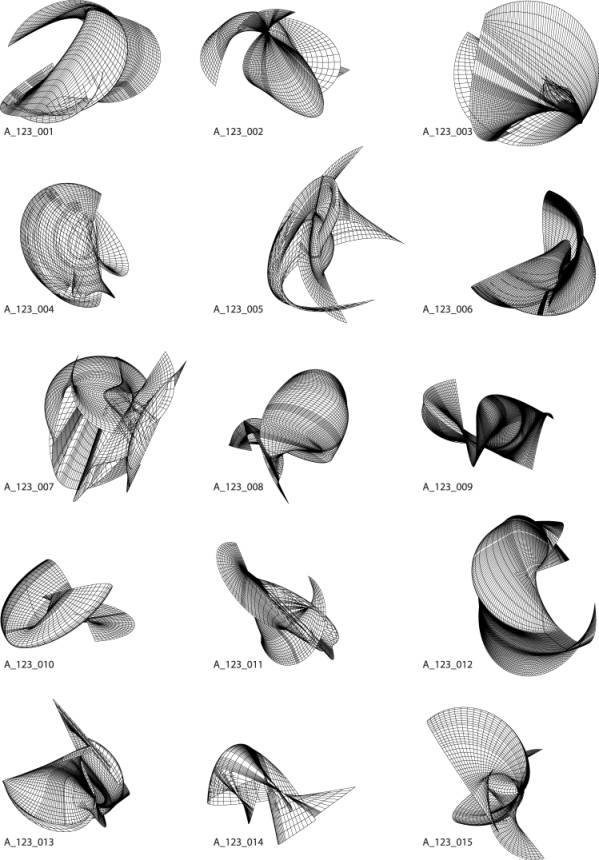
Fig 2 – First 15 of a Sequence of 123
Generated Events
2.1 First and Further Experiments - Results
The experiment showed the expected results. Among the 123 generated
events there have been some which seemed to be more interesting than their
neighbors. A few of them even had the potential to cause associations of
something concrete. But the density of results of this kind of quality was
quite low, about 5 from 100 events, which figured out as an average value
later. Also some other parameters could be identified that are restricting this
approach of generating drawings:
a) The mistakes in the process of vector file generation, which at least
is the base for this approach, could only be achieved with one single and
unfortunately six years old computer. Consequently the computing time to
generate the images was very long (About two days per 1000 events).
b) To increase or to lower the number of splines and/or points per
spline doesn't improve the results, in contrary: In the first case the
resulting structures have been too dense and the computing time again slowed
down tremendously. And in the second case the resulting structures became so
boring, that they didn't resemble anything.
c) The line structures attained their best effect only within the range
of a certain size and a certain stroke weight. The bigger the structures have
been scaled, the more distance to them has been maintained to discover
something, but with increasing distance the single lines started to disappear
and the whole thing lost its character. And in a very small scale the lines
partially melted to black dots.
The insights gained by the first experiments set the basic framework for
the generative approach. After that it only remained to solve the problem of
how to deal with the generated raw material and to chose and adequate form for
presentation.
2.2 Abundance of Images
The digital construction space is defined as a regular cube with edges
divided into one billion units each. This means that theoretically 10 to the
power of 54 different surface objects could have been generated. Actually
15.000 have been generated as raw material for this project. Printed out of 80g
paper, this still makes a pile of paper of about 1.50 m. For not getting lost
in this enormous amount of different images, very strict rules for the further
work on the raw material have been defined. The only allowed operations have
been: Rotating, scaling and collecting various images in one file.
High-resolution inkjet plots in different sizes from (40cm to 40cm until 70cm
to 100cm) have been used as output media. This way of presenting the project
was chosen to strengthen the analogue touch in the digital nature of the line
structures.
2.3 Interpretations
The interpretation of the material started to fall into place while
dealing with the generated material. When starting to organize the material,
concrete and abstract categories came into existence automatically: fishes,
dwarfs, fantasy creatures, bird heads and bodies have been drawing their
borderline from erotic, ridiculous, warlike or quarrelsome shapes.
From the delight of searching and discovering without purpose about 90
graphical works resulted. Each of these works has one of such categories as
main point of emphasis. The following Figures are showing 1:1 details from the
original prints.
The whole project will be shown at the end of January 2004 in an
exhibition in Erlangen (Southern-Germany) and be published in a catalogue.
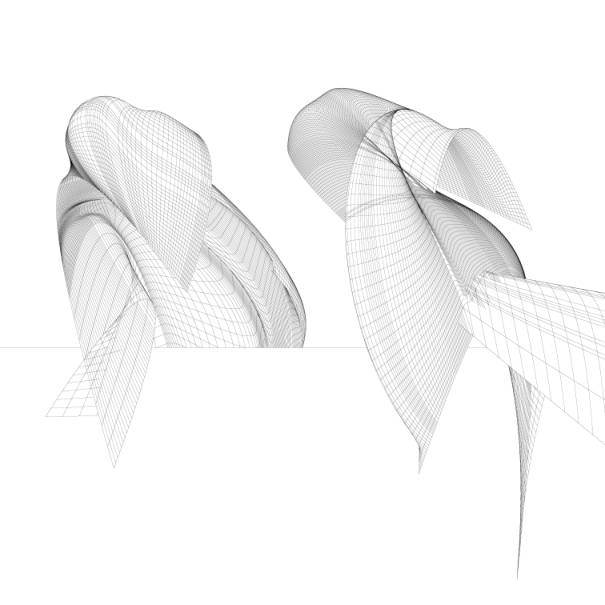
Fig 3 – 1:1 Detail of : 4birds_03 – size:
70cm x 50 cm
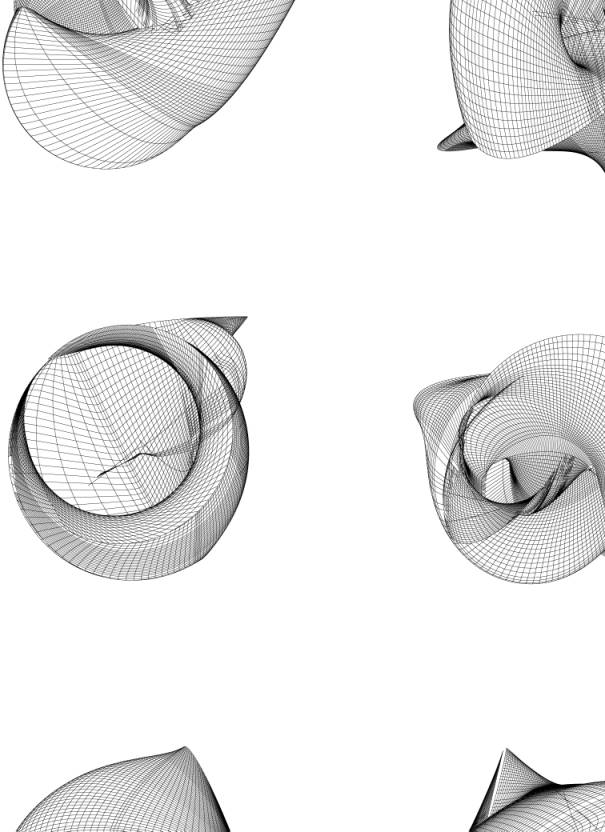
Fig 4 – 1:1 Detail of : shells – size:
100cm x 70 cm
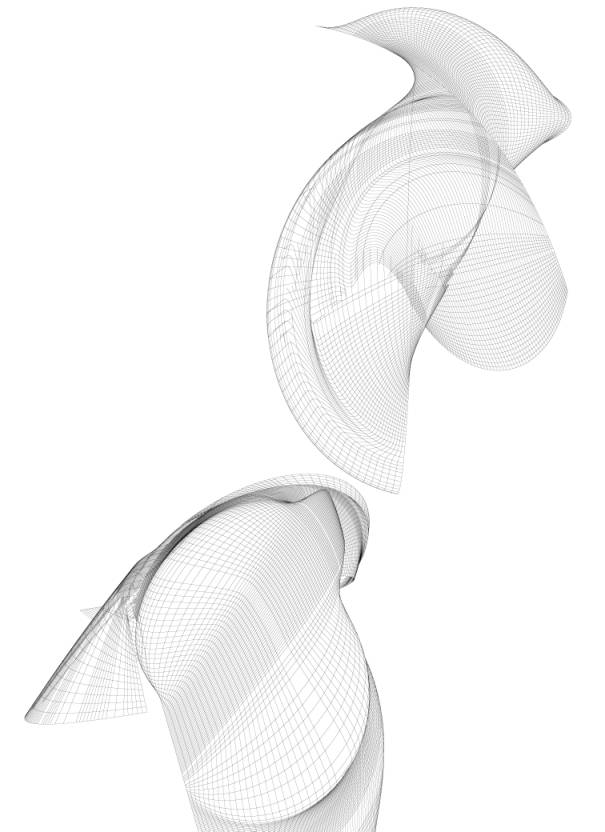
Fig 5 – 1:1 Detail of : akt_03 – size: 40cm
x 40 cm
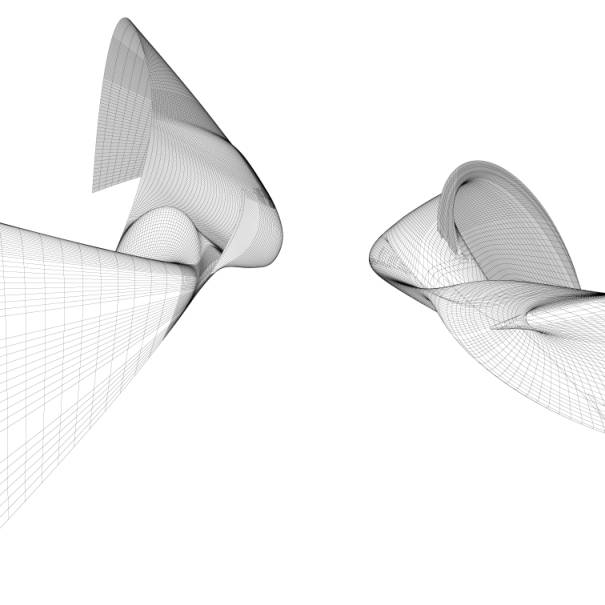 Fig 6 – 1:1 Detail of : imps – size: 50cm x
40 cm
Fig 6 – 1:1 Detail of : imps – size: 50cm x
40 cm
3. References
The main source of inspiration for this project was the line art of Hans Dehlinger. More:
http://www.uni-kassel.de/~dehlwww/