The Void
Series - Generative Art using Regulatory Genes
Gary R. Greenfield
Department of
Mathematics and Computer Science, University of Richmond, Richmond, Virginia
23173, USA.
e-mail:
ggreenfi@richmond.edu
Abstract
We apply a gene regulator model to
aggregations of cells in order to generate a series of two-dimensional abstract
art works titled “The Void Series”. Images in “The Void Series” arise from
grids consisting of two different types of cells. Cells in the grid undergo a
period of morphological development following which concentrations of three of
their four so-called transcription factors are interpreted as RGB color
components in order to create a finished piece. Cell morphogenesis is governed
by both a gene regulatory network and interactions among neighboring cells. By
initially activating only the outermost cells of the grid, and by controlling
for the length of time that cells are allowed to develop, we obtain an inward
spiral of alive cells surrounding an inner core of dormant cells. This means an
activation boundary is always present. The activation boundary reveals the
changes that occur within individual cells as they undergo morphological
development and symbolizes the extent to which we understand morphogenesis,
while the inner void symbolizes the extent to which we do not understand
morphogenesis. A genetic algorithm is used to evolve and select those images
offering the greatest aesthetic impact.
1. Introduction
Although simulation of cellular processes has
been previously used for artistic and scientific purposes, we are unaware of
any attempts to treat the process itself as an aesthetic entity. In this paper,
by loosely following a developmental model for cells based on differential gene
expression that was originally formulated by Eggenberger [1], we show how to
directly integrate such cellular processes into a generative system designed to
yield abstract aesthetic images. Because cellular processes are simulated, the
length of time for cellular development (i.e. morphogenesis) to occur becomes a
key variable that can be exploited for aesthetic purposes. During the course of
investigating this parameter, we were led to create a series of images called
``The Void Series.'' In addition to
yielding aesthetic imagery our methods also provide insight into some of the
wonders that are concealed within the inner workings of the cells themselves.
The most famous example involving modeling
cellular development for aesthetic purposes arose as a consequence of the tour
de force thesis of Kurt Fleischer [2].
His efforts spanned the disciplines of computer graphics [3,4],
artificial life [5], and generative art [6,7].
A less well-known example by Hoar et al [8] involving modeling the life
cycle of a bacterium led to images of the simulated evolution of bacteria
colonies that were proffered as “creative bacteria patterns.” It is clear,
however, that this work was intended primarily as a scientific visualization of
bacterial evolution and that the resulting aesthetic results were merely a
fortuitous by-product. While on the topic of related work, it should also be
pointed out that due to the occurrence of the rectangular patterns that occur
in our images, and in light of the fact his generative algorithm was used to
investigate the theoretical principles underlying Mondrian's paintings, it is
also worthwhile to compare our work with that of Feijs [9].
In subsequent sections we first describe our
regulatory gene model for cells and then our simulation of cellular
development. Next, we discuss from both a technical and artistic standpoint
``The Void Series'' that we created with the aid of a simple genetic algorithm.
Finally, we present conclusions and directions for future work.
2. The Gene Regulatory Model
Following Eggenberger, we formulate a model
for the cellular development of cells possessing identical genomes in such a
way that differences between cells are due to regulatory mechanisms that turn
genes on and off. The key idea is that segments within each cell's genome are
classified as either structural or regulatory and that regulatory segments
affect and are affected by immediately adjacent structural segments. Individual
cells maintain concentrations of transcription factors. When structural genes
are activated they yield products (morphogens) which alter the concentrations
of these transcription factors. In turn, transcription factor concentrations
help initiate higher order cell processes. In Eggenberger's model, depending on
the type of the structural gene, besides affecting transcription factor
concentrations gene products may directly initiate higher order cellular
processes such as mitosis, receptor activation, etc. In our model, the products of activated structural genes only
result in changes in the transcription factor concentrations that are
associated with those genes, with the caveat that one of the factors exerts
further control over such changes by determining whether or not neighboring
cells will also have their concentrations modified. In simpler terms, in our model structural genes are in one to one
correspondence with transcription factors; cells have four transcription
factors; and three of the transcription factors are responsible for the
concentrations of red, green, and blue while the fourth is responsible for
communication between a cell and the cells in its Moore neighborhood. The
activation of any specific structural gene is determined by transcription
factor affinities that result from structural and regulatory gene pairings as
described more fully below.
Formally, a gene is a string of eight digits
![]()
![]() (1)
(1)
all lying in the range zero through four. A
gene unit is a sequence of three genes, the first two being designated as
regulator genes and the third being designated a structural gene. Each structural gene is used to define an
offset ![]() and a diffusion
coefficient
and a diffusion
coefficient ![]() defined by:
defined by:
![]() (2)
(2)
![]() (3)
(3)
A cell genome consists of four gene
units. A cell consists of a cell genome
plus concentrations of four transcription factors (TF's). The TF's are in one
to one correspondence with the structural genes. For a fixed TF and a fixed regulatory gene we extract the
substring of length five from the regulatory gene beginning from the offset
determined by the structural gene of its unit, then perform a base five
conversion, and finally subtract the result from an environmental constant
associated with the TF in order to give the affinity of that regulatory gene
for that TF. Now, multiplying the
affinity of the TF by the concentration of the TF, and then summing over all
regulatory genes we threshold the result to determine whether the structural
gene associated to the TF is excitory, inhibitory, or neutral. Note that affinities are signed
quantities. Also note that in order to
help implement both increases and decreases in TF concentrations we have
further refined the classification of an activated gene as either excitory or
inhibitory. An activated structural
gene raises (respectively lowers) the concentration of the TF it influences by ![]() percent of the TF
increment constant, where
percent of the TF
increment constant, where ![]() is the diffusion
coefficient of the structural gene as that is given by (3). Further, if the
TF concentration responsible for intra-cellular communication is sufficiently
high, gene activation diffuses the remaining
is the diffusion
coefficient of the structural gene as that is given by (3). Further, if the
TF concentration responsible for intra-cellular communication is sufficiently
high, gene activation diffuses the remaining ![]() percent of the TF
increment constant to the nine neighboring cells. The subtlety here is that the
TF activated is not necessarily the TF whose concentration changes. In the
results described in this paper the red structural gene influences the green
TF, and conversely; while the blue structural gene influences the communication
TF, and conversely. The rationale for this is that a cellular mechanism that
leads to the activation of a gene may yield products that affect different
cellular mechanisms.
percent of the TF
increment constant to the nine neighboring cells. The subtlety here is that the
TF activated is not necessarily the TF whose concentration changes. In the
results described in this paper the red structural gene influences the green
TF, and conversely; while the blue structural gene influences the communication
TF, and conversely. The rationale for this is that a cellular mechanism that
leads to the activation of a gene may yield products that affect different
cellular mechanisms.
3. Simulation of Cellular Development
To simulate cellular development using our
gene regulatory model we arrange the cells in a grid. Edge cells of the grid are initialized with trace concentrations
of each of the transcription factors while the interior cells have their
concentrations all set to zero. At
every time step of the development process, for each cell in the grid we
perform the calculation described in the previous section to determine which
genes in the cell are activated, or expressed, and then we modify the
concentrations of the TF factors within the cells that are influenced by the
activated genes in the manner described in the previous section. For the images shown here, only two types of
cells are used in grids. One type of cell
provides the substrate, while the second type - comprising only five percent of
the grid - become the specialized cells.
For the images shown here the grid is 50x50 whence there are 2500
cells. The number of time steps
allotted for cellular development is set to 350. Since each cell is visualized as a 5x5 pixel region that is colored
according to the concentrations of its red, green, and blue transcription
factors, each grid yields a 250x250 pixel composition.
We embed image generation within a simple
genetic algorithm (SGA). When mating cells, we use the standard one-point crossover
operator and point mutation operator. To achieve image consistency we “freeze”
the placement pattern of the specialty cells so that throughout each run of the
SGA the specialty cells are always placed in exactly the same locations on all
grids. In our preliminary experiments
we used small grids with moderate population sizes and a large number of
generations, but to achieve the higher resolution results shown here, we were
forced to use smaller population sizes (typically 6-8) and fewer generations (usually
2-4). Due to the heavy computational
load it is not possible to use an interactive genetic algorithm. This means we must formulate a fitness
function. The difficult problem of designing appropriate fitness functions is
still being actively investigated. For
all images shown here, grid fitness is calculated using the expression
![]() (4)
(4)
where ![]() ,
, ![]() ,
, ![]() , and
, and ![]() denote the standard
deviation within cells of the TF concentrations for the (C)ommunication, (R)ed,
(G)reen, and (B)lue TF factors
respectively;
denote the standard
deviation within cells of the TF concentrations for the (C)ommunication, (R)ed,
(G)reen, and (B)lue TF factors
respectively; ![]() denotes the number of
cells that had a change in activation status for at least one structural gene
during the last developmental time step; and
denotes the number of
cells that had a change in activation status for at least one structural gene
during the last developmental time step; and ![]() denotes the number of
cells that are dormant i.e. the number of cells all of whose TF concentrations
lie below the trace value. Thus, grids
with high fitness reward images that possess variation within all color
channels and whose underlying cells are still actively turning genes on and
off, and penalize images that have too many black cells.
denotes the number of
cells that are dormant i.e. the number of cells all of whose TF concentrations
lie below the trace value. Thus, grids
with high fitness reward images that possess variation within all color
channels and whose underlying cells are still actively turning genes on and
off, and penalize images that have too many black cells.
4. The Void Series
Thanks to genetic variation, in any evolving
population of grids the resulting images will vary widely in the size of their
inner core - the central black, or void, region of dormant cells that is
activated from the outside in during the development phase. After selecting our
fitness function and running the SGA more than thirty times, we culled a series
of ten images – “The Void Series” - whose inner cores were all approximately
the same size, whose colorings best revealed the nature of the regulatory
processes, and whose compositions best revealed the aesthetic possibilities. In
this section we examine some of those images.
We begin with image #2 of “The Void Series”
because first, the turquoise specialized cells are clearly visible; second, the
diffusion of their gene products into the immediate substrate (and no further!)
is distinctive; and, third, the developmental phases of both types of cells are
clearly visible at the {\em activation boundary} around the dormant inner
core. Notice how the concentrations of
the color components have been pushed to their maximum levels in the cells
surrounding the specialized turquoise cells to form the white cells.
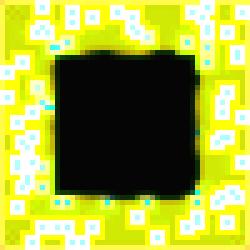
Figure 1.
The Void Series, Image #2.
Image
#3 of the series shows the opposite effect. The specialized cells have their
concentrations pushed to white by a very active substrate.
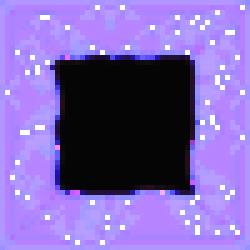
Figure 2.
The Void Series, Image #3.
Image
#9 of the series is intriguing because of the irregularities in the diffusion
patterns radiating from the specialized cells.
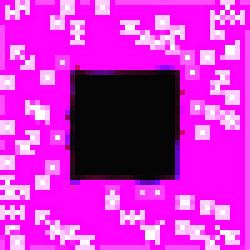
Figure 3.
The Void Series, Image #9.
In
image #1 of the series we see more clearly the developmental phases of the
specialized cells because they are neatly limned in white.
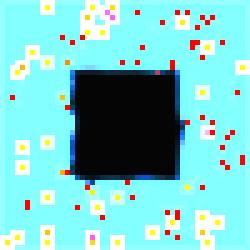
Figure 4.
The Void Series, Image #1.
Specialized
cell development can also be seen in image #7 of the series. Aesthetically,
image #7 is also interesting because of the blurring effect that results from
gene activity in the substrate.
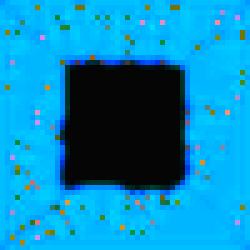
Figure 5.
The Void Series, Image #7.
Image
#4 of the series represents the best aesthetic result in our opinion, due no
doubt in part to the naturally occurring border.
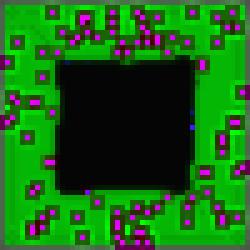
Figure 6.
The Void Series, Image #4.
Image #0 in the series is
the most vexing one because although its interwoven pattern of channels recurs
from time to time in our evolved imagery we have no satisfactory explanation
regarding its underlying cellular mechanism(s).
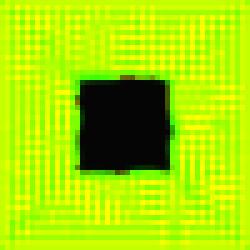
Figure 7.
The Void Series, Image #0.
The
above overly technical description of some of the images from “The Void Series”
does not speak to the artistic intent of the series. The conceptual intent of
these images is to initiate a dialog about cellular processes on two
levels. On the public macroscopic
level, by examining from a distance the inner core of dormant cells surrounded
by the organized pattern of active cells, the viewer is invited to question the
extent to which we truly understand the mysteries of cellular processes. On the private microscopic level, by
examining from close-up the intricate and complex dynamics occurring within the
cells that make up the activation boundary surrounding the inner core of
dormant cells, the viewer is invited to contemplate the awe and wonder of
cellular processes.
5.
Conclusions and Future Work
We have presented a gene regulatory model
that we used to simulate cellular processes.
By associating cell products with color channel components so that the
results of cellular development could be visualized, and by evolving cell
genomes with the help of a genetic algorithm, we developed a technique for
evolving aesthetic compositions that invites a dialog concerning our
understanding of cellular processes. The compositions of these images speak to
the marvels of cellular processes.
Future work could proceed in a number of
directions. First, it would be helpful
to try and simplify the gene regulatory model so that designing cell genomes could
be done on a more intuitive basis.
Second, additional effort should be devoted to trying to understand why
metrics for evaluating aesthetic fitness are, or are not, successful. Third, results obtained by initializing
grids in a more organized fashion, as opposed to just randomly sprinkling in a
few specialized cells, should be explored.
For example, using one cell type for a “nucleus” and a second cell type
for a surrounding membrane could prove worthwhile. Fourth, modifying cell genomes dynamically over the course of the
cellular development cycle might lead to novel imagery. Fifth, it would be interesting to experiment
with additional transcription factors: either visual ones, such as opacity to
use for compositing against a background image, or physical ones, such as
toxins that could induce more catastrophic cell changes.
References
[1] P. Eggenberger, Evolving morphologies of
simulated 3d organisms based on differential gene expression, Proceedings of
the Fourth European Conference on Artificial Life (ECAL97), 1997, 205-213.
[2] K. Fleischer, A Multiple-Mechanism
Developmental Model for Defining Self-Organizing Structures, PhD
Dissertation, Caltech,
Department of Computation and Neural Systems,
June 1995.
[3] K. Fleischer et al, Cellular texture
generation, Computer Graphics Proceedings, Annual Conference Series,
1995, ACM SIGGRAPH, 239-248.
[4] K. Fleischer, Cells: Simulations of
Multicellular Development, animation shown in Siggraph 94 Electronic Theatre,
in Siggraph Video Review, 1994.
[5] K. Fleischer, Investigations with a
multicellular developmental model, Artificial Life V Conference Proceedings,
1996, 229-236.
[6] K. Fleischer, Spike, computer image
exhibited in ACM Siggraph 95 Art Gallery, in Siggraph Visual Proceedings,
1995.
http://www.siggraph.org/artdesign/gallery/S95/Fleischer.html
[7] K. Fleischer, Who's Driving? Control
Issues for Generative Media, keynote presentation, First Iteration : a
conference on generative systems in the electronic arts, CD-ROM “D”, Dorin and
McCormack (eds), Melbourne, Australia, December, 1999.
http://www.csse.monash.edu.au/~iterate/FI/confProgram.html
[8] R. Hoar, J. Penner, C. Jacob,
Transcription and evolution of a virtual bacteria culture, 2003 Congress on
Evolutionary Computation Proceedings, IEEE Press, 2003, 54-61.
[9] L. Feijs, Divisions of the plane by
computer: another way of looking at Mondrian's nonfigurative compositions, Leonardo,
Vol. 27, No. 3, 2004, 217-222.