Selective Extraction of Point Sets from
Photographs as Starting Events of Generative-Art Line Drawings
Prof. H. E.
Dehlinger, PhD.
Kunsthochschule
Kassel, Generative Design Lab, University of Kassel, Germany.
e-mail: dehling@uni-kassel.de
Dr. Matthew R.
Lewis, PhD.
Advanced Computing
Center for the Arts and Design (ACCAD), The Ohio State University, Columbus,
USA
e-mail:
mlewis@accad.ohio-state.edu
Abstract
Assuming a reductionistic position, a drawing is
essentially an arrangement of lines and strokes. Whether placed on the paper by
the hand of an artist or by a generative algorithm, a drawing emerges in both
instances. Nevertheless, it seems reasonable to clearly distinguish between the
two production processes: “drawn by the hand of an artist”, and “drawn with an
algorithmic generative process”. In each one of these distinct universes, the
“Universe of hand drawing” and the “Universe of machine drawing”, infinitely
many very unique drawings exist. For the execution of a line, a certain (though
not necessary) logic prevails: The line starts at a defined point on the plane
and it ends somewhere on the plane. The decision of where to start has to be
made first, then the line may “develop”.
In this paper we concentrate on the question of
starting points with a focus to generate those from existing photographic
images. A procedure is proposed to extract and collect point sets as starting
events for generative-art line drawings. A number of strategies are suggested,
one of which is implemented using “Max” and “Jitter”, commercially available
software used primarily for real-time sound and video processing. The extracted
point-sets are then used as inputs to a generative programme. Experimental
drawings, following the rule system of this programme have been generated and
executed on a pen plotter. The results are encouraging and they suggest
interesting aspects for further research.
This project also forms the test bed of our investigations into the use of collaborative software, facilitating joint creation of generative artwork. A number of emerging technologies will be discussed which are enabling the interactive process of rapid generation and evaluation to be globally distributed.
Line Drawings, Hand and
Machine
We here consider algorithmic generated artwork based
on lines only. Such artwork is very close to what we usually refer to as being
a drawing. Our frame of reference for art drawings has quite naturally a focus
on drawings made by the hand of an artist. The “universe of hand drawings” is
accumulated over the centuries, a very richly populated universe indeed, and
its roots reach way back to the early beginnings of art as a manifestation of
mankind. The drawing is based on lines and strokes, which, viewed
geometrically, start at a particular location in the plane and end somewhere.
Between starting point and end point the line displays “character” which may be
thought of as a set of features such as soft, curling, thick-thin, straight,
light, poetic, violent and many others. The hand of an artist is capable of
producing a fantastic large number of such characteristics that we admire by
looking at drawings from the “universe of hand drawings”. The (art) drawings we are concerned with here
are of a very difficult nature. They all reside in the “universe of machine
drawings”, an equally rich and fantastic but only marginally explored universe
of its own [1,2].
Artists and programmers have studied a
multitude of methods for representing, searching, and culling the space of possible
machine drawings. From some of the
earliest machine drawing work by artists like Csuri and Cohen [3,4] to more
recent approaches by Bhatnagar, Orellana, Moura, and many others [5], exploring
methods of transferring the human ability to create drawings to machines
continues to be investigated. Whether
any of these approaches (or any possible approach) involves creativity remains
an open question [6,7].
Although we consider only some very specific aspects, we do this with the expressive intention of describing a complete generative production process for algorithmically generated artwork, based on lines. This process draws on existing software “Max” and “Jitter” [8] commercially available and primarily used for real-time sound and video processing, and a generative programme which has evolved over the years (from the early eighties) and has been used since to produce algorithmic generative drawings. In this programme, a particular emphasis is placed on the starting points of lines, the rational being: the starting point of a line has to be placed with great consciousness, because it is from this point where the line “develops” into the plane. The starting points for the line in a drawing have an overriding importance. As with decisions in art, such a statement is based on some “personal logic” and it is contaminated by ideological preconceptions – but nevertheless, it is working as a conceptual frame and, important in this context, it is easily cast into the code of a programme.
Photographs as Starting Events
Digital photographs are everywhere nowadays – we take
them with our mobile phones, with web cams, with small and large digital
cameras, and they are all over the web. For this work we filter such
photographs to extract point sets of a certain magnitude n (2000) at the
moment, which are then used as the starting points for lines in the generative
programme. The lines are polygons and are generated with a feature driver,
heavily relying on random processes. The generative pipeline for a drawing
includes these steps:
(1) Select photograph
(2) Manipulate photograph with Jitter
(3) Decide on filter strategy
(4) Extract point set
(5) Submit point set to generative programme,
generate drawing
(6) Plot result on pen plotter
The programme and the development of the cooperative
environment (steps 2 – 4) – which we regarded as an issue of highest priority
for this project – have been developed in Ohio. The generation of the drawings
and the plotting (steps 5 and 6) has been done in Kassel.
For the decision on which filtering method to use,
quite a number of strategies, including the following, are available:
(1) Use darkest area of photograph
(2) Use “light” areas only
(3) Use second level criteria
(4) “Thinning out” of pixels
(5) Pick in a range of p%
(6) Use Boolean operations
(7) Focus on a selected area, thin out rest
(8) Find contours, areas of changing density
We have initially focused on the strategy using the
darkest areas of a photograph, and we will investigate some of the other strategies
in further research efforts. Figure 1 shows the main steps of the process.
Figure 2 is showing a detail of the generated plotter drawing.
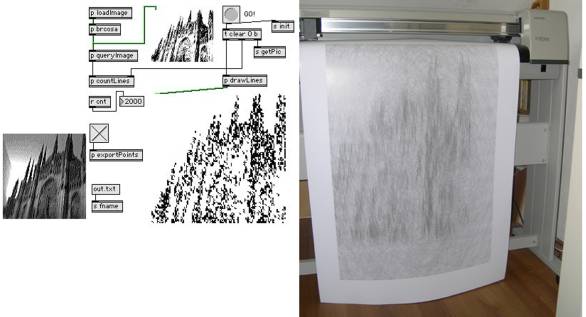
Fig. 1 Photograph of model of Duomo in Milan (left).
Jitter programme and visualization
of the resulting point set (middle). Plotter drawing
generated from derived point set (right).
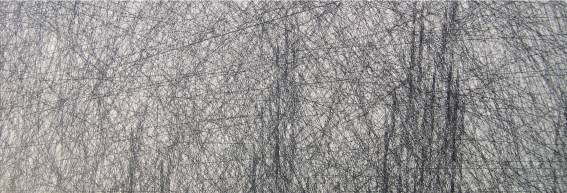
Fig. 2 Detail of the
generated plotter drawing
2.1 Data
points from images
Cycling `74’s Max
and Jitter software products are examples of a number of programmes, which
historically have allowed data filtering algorithms to be rapidly developed
graphically by the interactive creation of data-flow networks. These networks
consist of boxes of text and parameters, wired together to represent algorithms
(i.e., ordered processing functions, logic, control, etc.) Order, placement,
and position of the nodes and lines in these graphs are critical to the
execution of the programme. The interface for creating them is not unlike early
computer drawing programmes, but the data-flow “drawings” are functional. There
is of course something very attractive and elegant about drawing images which
can be executed to create drawings. The
visual representation of algorithms can provide a more intuitive interface for
artists and designers than would a text editor and compiler.
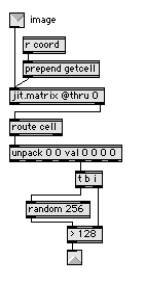
Fig. 3: Data-flow example: a simple “queryImage” sub patch
In the network in the left of Figure 2, a top-level
network (or patch) can be
functionally decomposed into a number of sub patches with inputs and outputs.
These sub patches are encapsulated in the boxes beginning with a p and given a unique name. An example of a simple queryImage sub patch responsible for sampling a picture at a given
coordinate is shown in Figure 3. For those unfamiliar, a brief walkthrough of
this patch should illuminate the means by which data-flow programming may be
conducted.
In the
patch in Figure 3, an image is first received and stored as a matrix at the top
(jit.matrix). A stream of sample coordinates arrive via
the receive object named coord (r coord). Each (x,y) coordinate pair
received is prepended with the message getcell
and passed to the matrix object. In response to each of these, the matrix
object emits a new message consisting of the word cell, followed by a set of seven arguments. When a cell message is detected it is routed
to the unpack object, which splits
up the list into individual arguments, only the fifth of which is used: the
value at the specified matrix coordinate location. This integer is stored in
place of the 128 in the > Boolean operator object. A random
number in [0,255] is then generated and compared to the stored value. This
particular sub patch example can be used to probabilistically create points at
dark or light locations. The bottom of the patch can be easily modified to
obtain any number of alternative results.
Returning to the primary algorithm, the patch in
Figure 2 when initialized loads and displays a user specified image. Users can
adjust the image’s brightness and contrast before initiating the point selection
process. When the GO button is
pressed, points are selected at random and tested for whatever traits are
specified by the queryImage sub patch discussed previously. Since the plotting
software has a limit of two thousand points per run, this was used as an upper
bound for point set generation. Once
the required number of satisfactory points has been found, the programme stops.
If the exportPoints sub patch has been activated, then each coordinate that
“passes” is normalized, scaled, and translated into plotting coordinates, and
exported to a text file in the format required by the plotting software.
|
0.54666 0.12833 0.94333 0.60199 0.44333 0.34766 0.58999 0.16099 0.50000 0.65799 0.33333 0.34999 0.91666 0.63933 0.49333 0.16799 0.31333 0.59033 0.59333 0.31499 0.47999 0.53899 0.38666 0.34299 0.50666 0.34533 0.50666 0.17499 0.86666 0.57866 0.37999 0.52033 0.56999 0.51566 |
0.54666 0.12833 0.54903 0.12329 0.55084 0.11961 0.55124 0.11722 0.55264 0.11343 0.55495 0.10844 -333.00000
-333.00000 0.94333 0.60199 0.94146 0.60374 0.93873 0.60651 0.93234 0.61264 0.92967 0.61509 0.92691 0.61742 -333.00000
-333.00000 0.44333 0.34766 0.44504 0.34497 0.44870 0.33979 0.45033 0.33564 0.45308 0.33079 0.45640 0.32556 -333.00000
-333.00000 0.58999 0.16099 0.59165 0.16275 0.59375 0.16477 0.59625 0.16747 0.59953 0.17078 0.60496 0.17600 -333.00000
-333.00000 0.50000 0.65799 0.49413 0.65950 0.48540 0.66072 0.48231 0.66276 0.47864 0.66382 0.47536 0.66495 -333.00000
-333.00000 |
PU;PU -1565, 4871; PD -1565, 4871; PD -1216, 4133; PD -850, 3712; PD -2095, 3376; PD -2292, 2880; PD -2531, 2113; PU;PU -5446, 5808; PD -5446, 5808; PD -5639, 5987; PD -5787, 6499; PD -6627, 7653; PD -6884, 8029; PD -7159, 8395; PU;PU 7000, 187; PD 7000, 187; PD 7203, -132; PD 8189, -422; PD 6907, -1744; PD 6859, -2558; PD 6849, -3490; PU;PU 7000, -1499; PD 7000, -1499; PD 7161, -1324; PD 7531, -1306; PD 7854, -916; PD 8395, -557; PD 9386, 74; PU;PU -4509, 3372; PD -4509, 3372; PD -5387, 3594; PD -6098, 1692; PD -6987, 4549; PD -7429, 4770; PD -7804, 4985; |
Fig. 4 Data point processing.
2.2 Data
point processing
A number of transformational steps have to be carried
through which end with the plotter drawing. In Fig. 4, the main steps are
illustrated by using the respective data format, which result from the
transformations. The left column of Fig. 4 shows the (x,y) coordinate-pairs for
starting points of polygons extracted from a photograph with Jitter. The column
in the middle shows the resulting (x,y) coordinate-pairs for polygon generation
(note the separation flags between polygon data), which come from the
generative programme. The entries on the right are an example of the HPGL code
needed for plotting. For clarity, the first three entries on the left are
arranged to correspond with the starting points of the generated polygons. As
the process continues, the content and size of the respective files changes.
The simple (x,y) coordinate pairs are expanded to represent polygons, starting
in the provided locations. This code in turn is expanded by adding the commands
required for plotting. Mostly these are Pen Up (PU) or Pen Down (PD) commands
for directing the pen, and a few other commands.
Collaborative Process
As an analog to the prior discussion of starting
points and plotting, the genesis of the authors’ collaborative process bears
examination. While initially meeting together at a Generative Art conference in
Milan (GA2000), it wasn’t until later meetings in Portugal and Los Angeles that
a way to work together was agreed upon. In addition to an interest in pursuing
the primary generative work described above, there was a strong desire to
attempt to explore the practical use of the many emerging technologies becoming
commonly available for collaborative work.
The results were mixed but illuminating and promising.
3.1
Remote cooperative design
Generative art has traditionally been created either
by single artist/programmers or occasionally by an artist working with a
programmer at the same site. While the tools have existed for some time at a
corporate level for remote collaborative work, and at times small groups of
artists have been able to briefly make use of such high-end equipment, it is
only recently that advances in commonly available, inexpensive software and
hardware have made it possible for individual artists to practically
investigate tools for working together on a global level, as if they were next
door from one another.
Software like SubEthaEdit [9], Wikis [10], and iChat
AV [11] are quickly approaching the point at which groups of individuals can
set up remote collaborations without requiring technical support teams. High quality full screen international video conferencing
is now available to anyone with a computer and a broadband connection. The
authors used Apple’s iChat AV with iSight Firewire cameras on Powerbooks to
communicate at will between Germany and the United States with great
success. Work was conducted for
arbitrary lengths of time, with cameras being manually redirected to show work
in progress, interfaces, explain new software, show and diagnose problems, etc.
The next generation of this video conferencing software to be released in a few
months will support shared connections between up to four users, which should
further increase collaborative abilities.
Collaborative
document editing tools are slowly becoming available. SubEthaEdit is one of the
more popular ones of the past couple years. It is commonly used among
co-located groups to jointly take notes, collaboratively authoring text
documents in real time. On the same network there is zero configuration
required. More recent versions support internet-wide document editing.
Wikis have the
advantages of being plain text, accessible with any web browser, and being open
to anyone with no user configuration.
This advantage can be a disadvantage of course if security is required,
but malicious changes are trivial to undo by the first person that spots
them. A Recent Changes log typically
makes this simple. There is a bit of a learning curve for creating new pages,
links, images, etc., but it is significantly simpler than learning HTML and web
page authoring (or a new word
processor, for that matter.)
Finally, by using
tools like Max that support drag and drop networking, assembling arbitrary
networked application construction has become possible for
non-programmers. Dancers, musicians,
and artists have for years now been able to build interfaces in which button
and slider events are transmitted globally.
Our goal in using these tools is the joint creation of generative artwork. We are working to
interactively generate and evaluate results at multiple locations, globally
distributing the creative effort as well as artistic and technical expertise.
Currently we are designing and developing a system architecture in which remote
and local viewers can control the display of remote views of collaborators, their desktops, and their environments.
3.2
Practical challenges
The most significant problem facing remote
collaboration is related to security, but not in the usual way. As levels of spam, worms, spyware and
viruses increase, system administrators are increasingly locking down their
networks. Perhaps paradoxically, while a relatively insecure site will have
little problem setting up and using remote collaborative tools, a site with better technical support will require more technical support. Negotiations and
justification of which network ports, of what type, in whose firewalls, need to
be opened to whom, can greatly complicate remote cooperation. SubEthaEdit,
iChat AV, and Max remote networking each gave us problems of this nature to
varying degrees. While video conferencing was easily resolved, two-way document
editing via SubEthaEdit and Max-based collaborative image editing were not.
Using a wiki provided the least amount of difficulties in this vein.
An open question also remains of how the initiation of such collaborations might be encouraged using collaborative emerging technologies. This current effort was born the “old fashioned” way: via dinners, talks, and meetings at international conferences.
3.3
Collaboration over time
It is not an uncommon position among Computer
Scientists to believe software is “rotting” and becoming obsolete very fast.
The mix of “old” and “new” programmes, hardware, systems and programming
languages used in the approach discussed here is strange enough to warrant
short reflection. Some of the “older” code used, like HPGL 1, draws its power
from the simplicity of the concepts behind it. With a few basic commands, code
to produce line-oriented plots can be written easily. It is so simple that we
can produce a running programme just by applying the “find and replace”
function of a text editor to a file of x,y coordinate-pairs. Programmes
generating HPGL code can be written in many programming languages. To solve
some of the generative issues in the development of the work reported here, the
programming language MaxSPITBOL[1],
based on concepts dating back to the late 60th of last century, has been used.
It is still running perfectly on new Macintoshes, and it is one of the cases
where the “rotting” in fact does not exist at all. Instead it turns into one of
the fabulous history stories in Computer Science of consistency and longevity.
In the beginning of the procedural chain we use Jitter, a quite modern tool,
and at the very end the plotting code. The final generative aspects are running
entirely on an old Apollo and the programme has been written in Fortran IV. And
this constellation has been producing drawings for many years [12].
Conclusion
Assuming, the starting points of lines are of
particular importance when a drawing is generated, and assuming the drawing
generator simply accepts supplied starting points, not producing them itself,
it makes sense to develop strategies for generating such sets of starting
points. It is suggested to use digital images (photographs) and extract sets of
data points (according to criteria) from them. A procedural chain has been
designed, programmed and applied, which will filter and transform those data
for input to the generative programme which will produce a pen plotter drawing
as a piece of art, standing in its own right. The results from these
experiments are encouraging. The drawings generated using this approach have a
strong, specific and consistent “character”.
The results of this effort have been produced in a
computer supported collaborative work process. We plan to continue exploring
collaborative software including shared desktop components, remote shared
control and viewing of software and hardware, and practical solutions to
networking challenges. Within generative art, the central topic of this paper,
a high demand for instrumental knowledge in quite disparate fields like
Computer Science, Art, Media and many others is common. Collaborative work
makes a lot of sense in this area. High-end collaboration solutions exist but
we desire artist accessibility for global collaborative tools without requiring
advanced technical support. The creation of generative art can be collaborative
across time, mixing old and new technology, and across space, bringing together
the different backgrounds and expertise of partners living distant from each
other.
References
[1] Dehlinger, H.; Qi, Dongxu "Art Experiments
and Mathematical Explorations into the Universe of Machine Generated
Drawings", Proceedings of the International Conference on Electronic Arts,
Chicago, ISEA 1997.
[2] "Bildnerische Experimente mit der
geplotteten Linie" in: Bauer, Dehlinger, Mathias; "Design, Kunst,
Computer: Computer in den künstlerischen Bereichen", Verlag Jenior und
Preßler, Kassel, Okt. 1991, ISBN 3-928172-07-7
[3] Csurivision Ltd. “The Art and Ideas of Charles
Csuri,” http://www.csurivision.com/csuri/, 2004.
[4] Harold Cohen. http://crca.ucsd.edu/~hcohen/, 2004.
[5] Artbots: The Robot Talent Show. http://artbots.org, 2004.
[6] Margaret Boden. The Creative Mind: Myths and
Mechanisms. Basic Books, 1991.
[7] Douglas Hofstadter. Fluid Concepts and Creative
Analogies. HarperCollins, 1996.
[8] Cycling `74. Max/MSP/Jitter. http://www.cycling74.com, 2004.
[9] TheCodingMonkeys. SubEthaEdit. http://www.codingmonkeys.de/subethaedit/,
2004.
[10] “What is Wiki.” http://wiki.org/wiki.cgi?WhatIsWiki,
2004.
[11] Apple Computer, Inc. iChat AV. http://www.apple.com/ichat/, 2004.
[12] Hans Dehlinger Zeichnungen, kassel university press GmbH, ISBN 3-89958-534-8, Kassel
2004, www.upress.uni-kassel.de